To build a cyber incident response flow chart, draw one path that runs from detection through analysis, containment, eradication and recovery to a post-incident review. Put a yes or no decision at every fork, give each box an owner, and test the finished chart with a tabletop exercise. A single page that your team has rehearsed will serve you better than a forty-page plan that nobody opens during an attack.
The problem is what happens under pressure. When ransomware lands at 2am, people skip steps, wipe machines that still hold evidence, or tell the wrong people too late. Most flow charts you can download are generic boxes and arrows. They show the stages but not the decisions, owners and deadlines that matter to a UK organisation.
TrustedIA helps businesses recover from cyber incidents through its CyberSOS incident response service, so we see which charts hold up when it counts. This guide takes you through five steps, with decision questions, a severity table and UK notification rules built in. It ends with a complete flow chart in copy-ready text that you can paste into a diagram tool and adapt.
Why you need a flow chart before an incident
A cyber incident response flow chart is a one-page visual of the decisions your team makes between the first alert and the final review. It exists because people think badly under stress, and a chart replaces memory with a route. You draw it when things are calm so that nobody has to invent a process while systems are down.
What the flow chart does and does not do
A flow chart shows the order of actions and the decision points, such as "is this an incident?" or "is personal data involved?". It does not hold the technical detail. That belongs in playbooks for specific scenarios such as ransomware, phishing or a lost laptop.
Think of a cyber security incident response plan flow chart as the front page of your written plan. The plan explains who, why and how. The chart tells whoever is on call what happens next and who decides. If your chart needs a second page, you have probably pasted playbook detail into the wrong document.
A good chart answers "what do I do next and who decides", not "how do I do it".
What to have ready before you draw
Gather these inputs first, because every box on the chart depends on one of them:
- Key contacts: the incident manager, IT, senior management, legal, HR, communications, your insurer and your incident response provider. Give at least two contact methods for each person and name a deputy.
- A severity scale: four levels are enough, and Step 1 gives you a starting point.
- Roles: who runs the incident, who leads technically, who speaks to staff and customers, and which executive can approve drastic actions.
- An asset list: which systems and data matter most, so that you can rank recovery.
- Logging and backups: a record of where logs live and which backups are offline or immutable.
- A separate communication route: a phone bridge or messaging group that still works if email and Teams are down.
- Insurance details: the policy number, the notification requirements and the insurer’s incident line.
If you lack any of these, fix that gap first. A chart with a box saying "call legal" is useless when nobody has the number.
The stages your chart should cover
Most teams draw six stages. NIST’s classic four-phase model groups three of them together, which is accurate but too coarse for a diagram. Splitting them gives you a clearer decision at each point. Preparation sits outside the chart because it feeds every box rather than being a step you take during an incident.
| Chart stage | NIST four-phase model | What the stage decides |
|---|---|---|
| Preparation | Preparation | Sits before the chart: contacts, tools, training |
| Detection | Detection and analysis | Is this a real incident or a false alarm? |
| Analysis and triage | Detection and analysis | How severe is it, and what type is it? |
| Containment | Containment, eradication and recovery | How do we stop the spread without losing evidence? |
| Eradication | Containment, eradication and recovery | Is the attacker’s foothold fully removed? |
| Recovery | Containment, eradication and recovery | Which systems return first, and are they clean? |
| Post-incident review | Post-incident activity | What do we change so this does not repeat? |
The UK National Cyber Security Centre publishes incident management guidance that follows the same lifecycle, so your chart will line up with what regulators and insurers expect to see.

Step 1. Detect, analyse and triage the event
Start the chart with a trigger box and one decision: is this a security incident? Everything after that depends on a quick, honest answer. Then triage by severity so that the response matches the size of the problem. A cyber incident response flow chart that skips triage treats a blocked phishing email and a ransomware outbreak in the same way.
Define the trigger and the first decision
Alerts reach you from many places: an endpoint detection tool, a member of staff, a supplier, a customer or a ransom note on a screen. Every route should feed the same first box, so that nobody wonders where to report. Say in plain words who receives reports and how.
Then define three terms on the chart itself. An event is any observed change, such as a login. An alert is a suspicious event that needs someone to look at it. An incident is an event that harms, or could harm, the confidentiality, integrity or availability of your data or systems. The first decision box asks whether the alert meets that last definition.
If the answer is no, the branch should still end in a log entry. False alarms teach you which detection rules are noisy. If the answer is yes, three actions follow straight away: open an incident record, timestamp it, and assign an incident manager.
Score severity with a simple matrix
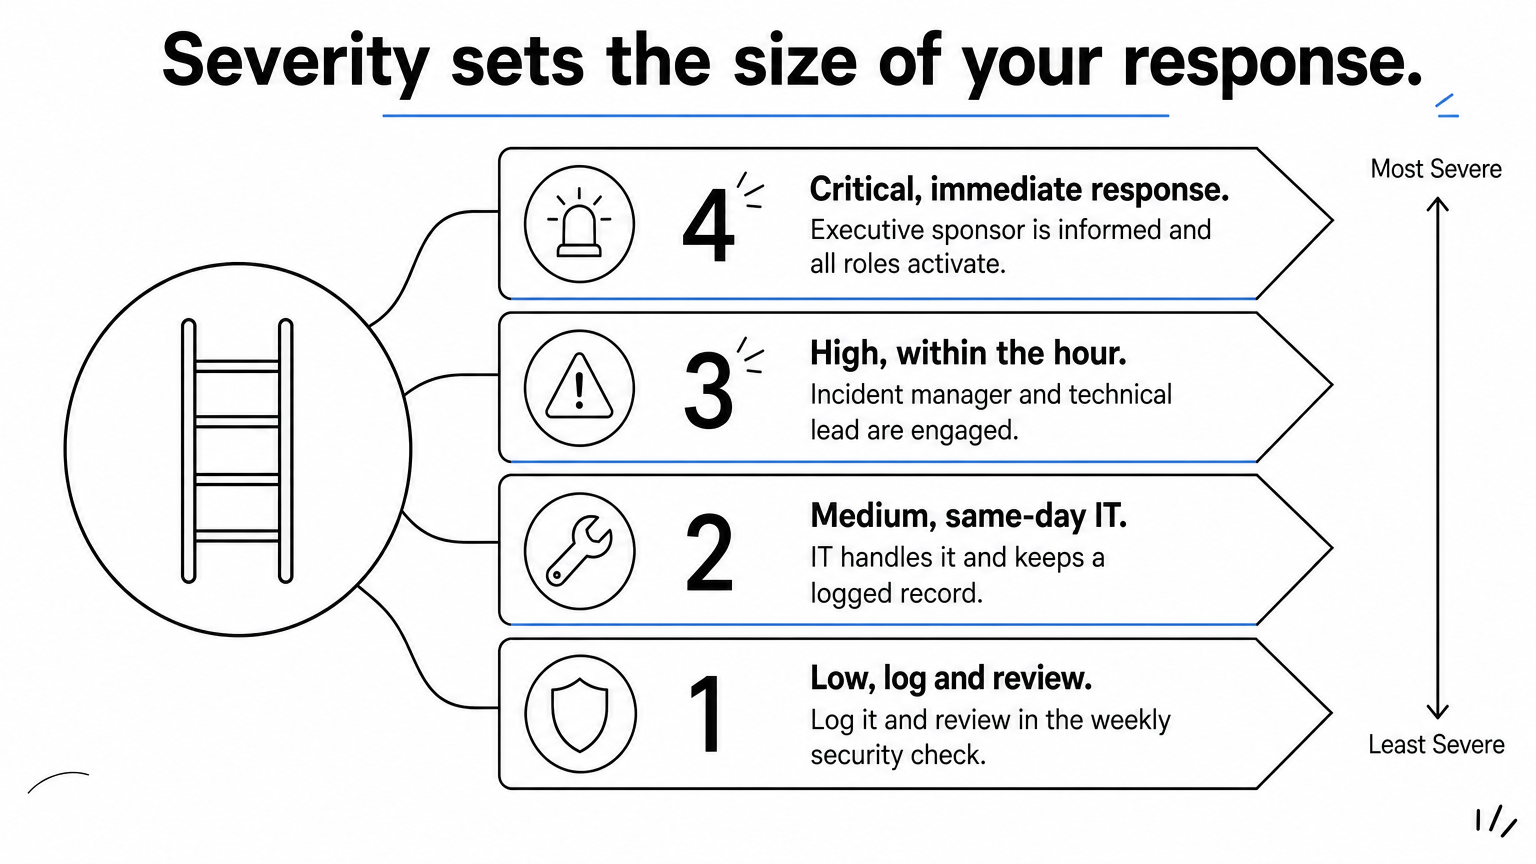
Severity decides who gets woken up and how fast you move. Judge it against availability (can people work?), confidentiality (has data been accessed or taken?) and integrity (can you still trust your data and systems?). The table below is a starting point. Tailor the examples to what matters in your business.
| Severity | Example triggers | Example response |
|---|---|---|
| Critical | Ransomware on core systems, confirmed theft of customer data, most staff unable to work | Immediate. Executive sponsor informed at once, all roles activated |
| High | Compromised administrator account, one critical system down, suspected exposure of personal data | Within the hour. Incident manager and technical lead engaged |
| Medium | One compromised user account, malware contained on a single device | Same working day. Handled by IT with a logged record |
| Low | Blocked phishing email, one non-critical device affected | Log it and review in the weekly security check |
Put the severity level on the chart as a branching box. Critical and High go to the full team and to the notification branches in Step 4. Medium and Low stay with IT but still follow the same containment and recovery boxes.
Severity is the switch that decides how big your response is, so score it before you touch anything.
Step 2. Contain the incident
Containment is the box where you stop the damage spreading, and your chart should ask two questions in it: what must be isolated, and what must be preserved first. Speed matters here, but acting without a plan destroys evidence and can alert the attacker. A cyber incident response plan flow chart earns its keep at this stage, because rushed decisions are the costly ones.
Choose short-term containment actions
List the actions your team is allowed to take without further approval, and the ones that need the incident manager’s sign-off. Typical short-term actions include:
- Isolating an affected device through your endpoint detection tool or by unplugging it from the network.
- Disabling compromised user and service accounts.
- Blocking malicious IP addresses and domains at the firewall.
- Segmenting affected network zones from the rest of the estate.
- Making shared drives read-only to slow file encryption.
- Rotating exposed passwords, tokens and keys.
Isolate rather than power off where you can, because shutting a machine down wipes the memory that investigators may need. The exception is active encryption that you cannot otherwise stop. In that case speed wins, and the chart should say so.
Preserve evidence before you change anything
Add a decision box after containment: "Has evidence been preserved?" If not, the branch loops to a capture step. Take copies of relevant logs, disk images or memory where you can, screenshots of ransom notes, and a written timeline with timestamps. Record who handled what and when.

This is not just good practice. Your insurer, a regulator or the police may all ask for it later, and a chain of custody is hard to reconstruct afterwards. If you do not have the skills in house, the chart should name the external provider to call.
One more decision belongs here. If there is a ransom demand, the chart should send it straight to senior management and legal advisers. Paying is a board-level and legal decision, never one for the technician on shift.
Contain first, but never at the cost of the evidence you will need later.
Step 3. Eradicate the threat and recover
Eradication removes the attacker and the way in. Recovery brings systems back in a safe order. Draw them as two boxes joined by a verification decision, with a loop back to containment if anything looks wrong. This is where a cyber incident response flow chart prevents the most repeat incidents, because it forces someone to confirm the threat is really gone.
Remove the cause, not just the symptom
Deleting the malware is not eradication if the attacker can walk back in. Your chart should ask: "Have we identified how they got in?" If the answer is no, loop back to analysis. If yes, the eradication box covers:
- Removing malware, backdoors and unauthorised accounts or scheduled tasks.
- Closing the entry point, for example by patching an exploited vulnerability or enforcing multi-factor authentication on an exposed service.
- Resetting credentials, including service accounts and any shared secrets the attacker may have seen.
- Rebuilding affected hosts from known-good images instead of cleaning them in place.
Rebuilding costs more time up front, but it removes doubt about what was left behind. That is usually the better trade.
Recover in priority order and verify
Recovery follows business priority, not whichever server is easiest. Use your asset list and business continuity plan to set the order. A common sequence is identity services, core network, critical business applications, then everything else.

Restore from backups that predate the compromise, and scan them before reconnecting. Bring systems back in stages, and watch each stage for signs that the attacker has returned.
Then add the verification diamond: "Are systems clean and stable?" If no, the arrow goes back to Step 2. If yes, move to closure, but keep heightened monitoring in place for a set period. Two to four weeks is a sensible starting point for most organisations.
A recovery that nobody verified is only the start of the next incident.
Step 4. Add escalation and notification branches
Escalation and notification run alongside the technical path, not after it. Add three side branches to your chart: leadership, legal and regulatory, and your insurer. Each one starts from a question that can be answered during triage. Without these branches, a technically perfect response can still leave you in breach of a legal deadline.
Set escalation triggers and roles
Escalation criteria should be written as rules, not left to judgement at 3am. Common triggers are any Critical incident, any suspected personal data breach, any ransom demand, any suspected insider involvement and any outage that passes a set duration.
Name four roles on the chart. The incident manager coordinates and keeps the decision log. The technical lead directs containment and recovery. The communications lead handles staff, customers and press. The executive sponsor approves high-impact actions such as shutting down a revenue system. In a small business one person may hold two roles, and that is fine, as long as the chart says who.
Decide who must be told, and by when
Draw a question near the top of the chart: "Is personal data involved?" If yes, a separate branch starts a clock. Under UK GDPR you must report a notifiable personal data breach to the ICO within 72 hours of becoming aware of it, unless it is unlikely to result in a risk to people’s rights and freedoms. See the ICO’s guidance on reporting a breach. If the risk is high, you must also tell the affected individuals without undue delay.
| Trigger | Who to tell | Timing |
|---|---|---|
| Personal data breach that risks individuals | ICO | Within 72 hours of becoming aware |
| High risk to individuals | Affected individuals | Without undue delay |
| Any claim you may make | Cyber insurer | Check your policy wording, as prompt notice is often required |
| Regulated sector | Your sector regulator | Per that regulator’s own rules |
| Suspected crime | Police | As soon as practical |
| Contractual duties | Affected customers and suppliers | Per contract terms |
Treat this table as a prompt, not legal advice. Have your legal adviser or data protection officer confirm the entries for your organisation.
The 72-hour clock starts when you become aware, so the chart must start it at triage, not at the end.
Step 5. Review, assemble and test the chart
Close the loop with a post-incident review, join all the boxes into one diagram, and test it before you rely on it. A cyber incident response flow chart is only finished once people have walked through it and you have changed what did not work.
Add the post-incident review
Do not mark an incident closed until the review has happened. Hold it within a couple of weeks, while memories are fresh, and keep it blameless. The goal is to find where the process failed, not who failed.
Cover these questions:
- How was the incident detected, and could it have been detected sooner?
- Which decisions were slow, unclear or wrong, and why?
- Did the chart match what people actually did?
- Which controls, contacts or playbooks need changing?
Capture simple metrics too: time to detect, time to contain and time to recover. Compare them across incidents. Then update the chart and send the changes to everyone with a role on it.
Assemble the full flow chart
The text below describes a complete chart in Mermaid, a plain-text diagram format that GitHub’s markdown and many documentation and diagramming tools render automatically. Paste it into any Mermaid-compatible editor, or redraw it by hand. Then replace the generic boxes with your own owners, contacts and thresholds.
flowchart TD
    A(["Start: alert or report received"]) --> B{"Is it a security incident?"}
    B -->|No| C["Log as an event and close"]
    B -->|Yes| D["Open incident record, assign incident manager"]
    D --> E["Triage: set severity Critical, High, Medium or Low"]
    E --> F{"Is personal or regulated data involved?"}
    F -->|Yes| G["Alert legal or DPO and start the 72-hour ICO clock"]
    F -->|No| H
    G --> H["Contain: isolate systems, disable accounts, block indicators"]
    H --> I{"Is evidence preserved?"}
    I -->|No| J["Capture logs, images and timeline"]
    J --> K
    I -->|Yes| K["Eradicate: remove malware, close entry point, reset credentials"]
    K --> L["Recover: restore from clean backups in priority order"]
    L --> M{"Are systems clean and stable?"}
    M -->|No| H
    M -->|Yes| N["Notify insurer, stakeholders and regulators as required"]
    N --> O["Post-incident review and update plan"]
    O --> P(["Close incident"])
Test it with a tabletop exercise
Pick a realistic scenario, such as ransomware that has encrypted your file server. Gather the people named on the chart and walk through it box by box with a timer running. Note every point where someone hesitated, asked "who does this?" or found a contact number was wrong.
Fix those gaps the same week. Repeat the exercise at least once a year and after any major change, such as a new system, a supplier change or a team reshuffle.
A flow chart that has never been rehearsed is only a drawing.
Put the chart to work
A good cyber incident response flow chart is short, decision-led and owned. Detect and triage, contain while preserving evidence, eradicate and recover with verification, run escalation and notification in parallel, then review and test. Draw it now, while nothing is on fire, and keep it where your team can find it when email is down.
If you would rather not build and test this alone, you do not have to. Speak to TrustedIA about cyber incident response support and we will help you turn this chart into a rehearsed, working process.